Fusedash vs StatPecker
Side-by-side comparison to help you choose the right AI tool.
Fusedash transforms raw data into actionable dashboards and reports to accelerate team productivity.
Last updated: March 4, 2026

StatPecker
StatPecker empowers businesses with instant, secure data insights and stunning visuals for impactful decision-making.
Last updated: March 1, 2026
Visual Comparison
Fusedash

StatPecker
Feature Comparison
Fusedash
Unified Data Visualization Workspace
Fusedash consolidates dashboards, charts, maps, and narrative reporting into a single, cohesive platform. This eliminates the need to toggle between disparate tools, ensuring that all visualizations are built from the same consistent dataset and metric definitions. Teams can customize layouts, filters, and time ranges for different audiences, reusing the same core structure to maintain data integrity while tailoring the view for executives, marketing, or operations, thereby streamlining the entire reporting workflow.
AI-Powered Chart Generation
This feature allows users to rapidly generate clear, accurate visualizations directly from CSVs or connected APIs. The AI assists in selecting the optimal chart type, applying relevant comparisons, and refining labels to ensure the visual correctly conveys the underlying story. These charts can be used as standalone assets for presentations or seamlessly embedded into broader dashboards, significantly accelerating the initial data exploration and report-building process for analysts and business users alike.
Consistent Metric & KPI Governance
Fusedash enables organizations to formally define and standardize key metrics, dimensions, and calculations in a central repository. Once established, these certified definitions are automatically applied across every dashboard, chart, and report. This governance layer eradicates conflicting data stories, builds trust in the numbers, and ensures that every department is making decisions based on the same validated performance indicators, which is critical for strategic alignment.
Natural Language AI Chat for Data Exploration
Integrated Smart Chat allows users to interact with their data using plain language queries. Users can ask questions about trends, request specific breakdowns by segment or region, and receive intelligent suggestions for relevant metrics or visualizations. This conversational interface lowers the barrier to data analysis, enabling non-technical stakeholders to derive insights independently and instantly transform those insights into shareable, persistent dashboard views.
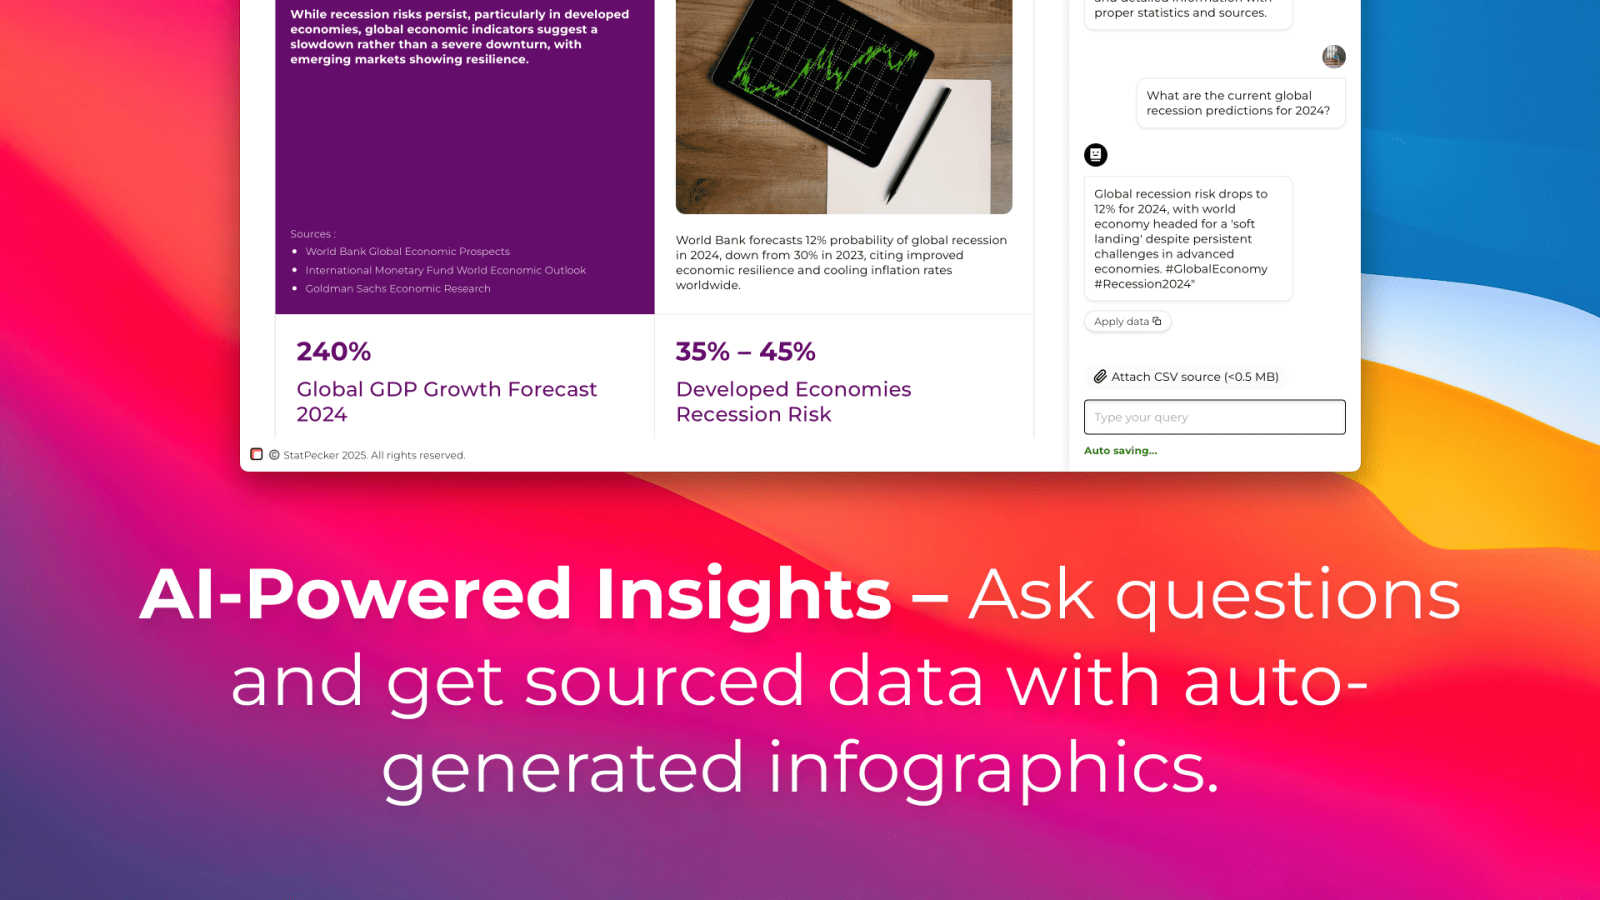
StatPecker
Ask Your Query
StatPecker allows users to obtain instant insights from validated sources using AI technology. By simply asking questions in natural language, users can receive accurate and relevant visual data without the need for complex tools, streamlining the analytics process significantly.
Publish & Embed
With StatPecker, users can create interactive visuals that can be easily integrated into blogs, articles, and websites. This feature enhances the accessibility and engagement of data insights, allowing for a more dynamic presentation of information.
Upload & Analyze CSVs
Users can upload local CSV files of up to 50 MB and analyze them without the cumbersome process of spreadsheets. StatPecker’s on-device analysis ensures that data privacy is maintained while allowing for swift extraction of key insights.
Download & Use Anywhere
StatPecker enables users to export their infographics as images, making it simple to use them in various formats such as reports and presentations. This flexibility ensures that users can share their visual content across multiple platforms effortlessly.
Use Cases
Fusedash
Executive Performance Reporting
Leadership teams utilize Fusedash to create consolidated executive dashboards that provide a real-time, high-level view of organizational health. By combining financial, operational, and customer metrics into a single narrative report with storytelling sections, executives gain immediate context on what changed, why it matters, and what actions are recommended, reducing time spent in lengthy briefing meetings and enabling faster, data-driven strategic decisions.
Marketing Campaign Analysis
Marketing departments leverage the platform to monitor campaign performance across multiple channels in real time. They can build interactive dashboards to track KPIs like CAC, ROAS, and engagement, use the AI chart generator for rapid creative or segment performance analysis, and drill down into geographic data on maps to assess regional effectiveness. This unified view prevents data fragmentation between platforms and accelerates optimization cycles.
Operational Monitoring and Diagnostics
Operations and support teams use Fusedash for live monitoring of key processes and customer service metrics through real-time interfaces. When a KPI deviates, teams can immediately drill down into specific time periods, agent groups, or product lines to diagnose the root cause. This capability transforms monitoring from a passive alerting system into an active diagnostic tool, minimizing downtime and improving service quality.
Cross-Departmental Business Reviews
Fusedash serves as the central platform for quarterly and monthly business reviews (QBRs/MBRs). Instead of compiling conflicting slides from various departments, teams share a single, interactive Fusedash report. Each department can have its own filtered view within the same dataset, ensuring all discussions are based on consistent numbers, which streamlines preparation, enhances meeting productivity, and drives collective accountability.
StatPecker
Market Research Analysis
Market analysts can leverage StatPecker to quickly visualize trends and patterns in their data. By using the platform, they can create infographics that effectively communicate their findings to stakeholders, facilitating informed business decisions.
Educational Presentations
Educators can utilize StatPecker to generate visually appealing infographics that make complex information more digestible for students. This enhances classroom engagement and helps students better understand data-driven concepts.
Content Marketing Strategies
Content creators can use StatPecker to produce high-quality visuals that complement their articles and blogs. By embedding these infographics, they can enrich their content, making it more engaging and shareable across social media platforms.
Performance Reporting
Business strategists can automate the preparation of performance reports using StatPecker, eliminating the need for manual data compilation. This not only saves time but also ensures that reports are visually appealing and easier for stakeholders to interpret.
Overview
About Fusedash
Fusedash is an enterprise-grade AI data visualization platform engineered to eliminate data silos and reporting inefficiencies that plague modern organizations. It provides a unified workspace where teams can transform raw, connected data from disparate sources into a single source of truth. The platform empowers users to create decision-ready dashboards, interactive charts, detailed maps, and narrative reports without the need to rebuild core logic across multiple, disconnected tools. Its foundational value proposition is consistency and operational efficiency: key metrics and KPIs are defined once and then reused across every view and report, ensuring alignment from leadership to frontline operations. Built for teams burdened by manual reporting cycles and conflicting data narratives, Fusedash not only enables real-time performance monitoring but also facilitates deep diagnostic analysis through intuitive drill-downs. Integrated AI capabilities, including natural language data chat and smart visualization assistance, democratize data exploration, making it faster and more accessible. By turning complex datasets into clear, actionable insights, Fusedash drives organizational alignment, accelerates decision-making, and delivers measurable ROI by drastically reducing the time spent on data wrangling and report generation.
About StatPecker
StatPecker is an enterprise-grade AI data visualization platform designed to revolutionize the way businesses interpret and present their data. By transforming raw data into visually compelling infographics in mere seconds, StatPecker addresses the pressing challenge of time-consuming and costly manual reporting. This platform automates the entire data storytelling workflow, enabling users to seamlessly ask natural language queries, upload CSV files, and generate publication-ready visuals instantly. StatPecker is tailored for professionals who depend on data-driven communication, including content creators, market analysts, business strategists, marketing teams, and educators. Its main value proposition lies in enhancing the clarity and engagement of insights, making them easily shareable and impactful. With StatPecker, organizations can significantly reduce production time and resource allocation, ultimately leading to improved decision-making speed, stakeholder engagement, and a powerful narrative in reports, presentations, and digital content.
Frequently Asked Questions
Fusedash FAQ
What types of data sources can I connect to Fusedash?
Fusedash offers flexible data integration capabilities designed for enterprise environments. You can start by uploading CSV files for quick analysis or connect directly to live data sources via API integrations, including databases, CRM platforms, marketing tools, and financial systems. The platform also allows you to combine multiple datasets into a single unified view and enrich your analysis with relevant public data, ensuring a comprehensive analytical foundation.
How does Fusedash ensure data consistency across different reports?
Consistency is a core architectural principle of Fusedash. The platform allows you to centrally define and manage your key metrics, dimensions, and calculation formulas. Once these "single sources of truth" are established, they are automatically applied to every dashboard, chart, and report built within the workspace. This governance model eliminates manual errors and definitional drift, guaranteeing that all teams across the organization are analyzing and reporting from the same trusted dataset.
Is the AI Chat feature suitable for non-technical business users?
Absolutely. The AI Chat (Smart Chat) feature is specifically designed to democratize data access. Users can ask questions about their data using natural, plain language—for example, "What were sales in the Northwest region last quarter?" or "Show me a breakdown of customer churn by product line." The AI interprets these queries, generates the appropriate analysis or visualization, and allows users to instantly save the results as a new view, making advanced analytics accessible without requiring SQL or technical expertise.
Can I use Fusedash for both real-time monitoring and static reporting?
Yes, Fusedash is built to support the full spectrum of data consumption needs. You can create real-time interfaces that refresh automatically to monitor live KPIs, such as website traffic or support ticket volume. Simultaneously, you can use the same connected data to build polished, narrative-driven reports for leadership, complete with storytelling context. This dual functionality ensures you have one platform for both operational vigilance and strategic communication.
StatPecker FAQ
How does StatPecker handle data privacy?
StatPecker prioritizes data privacy by conducting on-device analysis, meaning that your data remains on your device during the analysis process. This ensures that sensitive information is not shared externally.
Can I integrate StatPecker with other tools?
StatPecker's visuals can be published and embedded into various platforms, making it easy to integrate with content management systems, blogs, and social media, enhancing your overall content strategy.
What file formats does StatPecker support for uploads?
Currently, StatPecker supports CSV file uploads of up to 50 MB. This allows users to analyze structured data efficiently without the complexities often associated with other file formats.
Is there a limit to the number of queries I can make?
With the free tier, users can make up to 25 AI queries, while the paid tier offers unlimited queries. This flexibility allows users to explore their data thoroughly and extract actionable insights as needed.
Alternatives
Fusedash Alternatives
Fusedash is an AI-powered business intelligence and data visualization platform. It consolidates disparate data sources into a unified workspace, enabling teams to build consistent, decision-ready dashboards and reports. The platform's core strength lies in creating a single source of truth, eliminating manual reporting cycles and conflicting data narratives across departments. Organizations may seek alternatives to Fusedash for various strategic reasons. Common drivers include specific budget constraints, the need for deeper integration with an existing enterprise tech stack, or requirements for highly specialized analytical functions not covered by a generalist platform. Evaluating the total cost of ownership and long-term scalability is also a frequent consideration. When assessing other solutions, key criteria should include the ability to maintain consistent metric definitions, support for real-time data exploration, and the overall efficiency gained in report creation and distribution. The ideal platform reduces time-to-insight, empowers non-technical users with self-service analytics, and provides robust security to protect sensitive business data.
StatPecker Alternatives
StatPecker is an enterprise-grade AI data visualization platform designed to transform raw data into actionable insights through compelling infographics. It automates the often time-consuming and costly manual reporting process, enabling users to generate publication-ready visuals instantly. As organizations seek to maximize efficiency and improve decision-making, many users look for alternatives due to varying factors such as pricing, feature sets, and specific platform needs. When considering alternatives, it is essential to evaluate the core functionalities that can enhance your data storytelling capabilities, such as ease of use, integration options, and the ability to generate interactive visualizations. Additionally, the level of AI support and the flexibility to handle various data formats should be prioritized to ensure a seamless transition and optimal value.