Dividend Data vs GrowPanel
Side-by-side comparison to help you choose the right AI tool.
Dividend Data
Get data & 30+ yrs history in Sheets/Excel fast.
GrowPanel
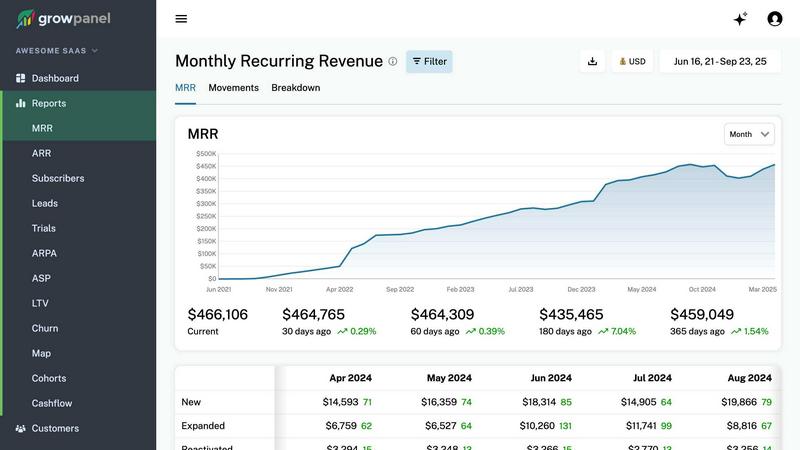
GrowPanel delivers real-time MRR, churn, and LTV insights for SaaS, empowering smarter growth and data-driven decisions.
Last updated: February 26, 2026
Visual Comparison
Dividend Data

GrowPanel
Overview
About Dividend Data
Dividend Data brings 30+ years of stock market data for 80,000+ tickers directly into your Google Sheets and Microsoft Excel spreadsheets — no API keys, no coding, no copying and pasting.
Built for dividend & fundamental investors, it gives you instant access to dividends, yields, payout ratios, growth rates, financial statements, earnings, ratios, price history, and 100+ metrics through simple custom formulas.
Just type a formula. The data appears live.
What makes it different:
• Free tier with 2,500 monthly credits — no trial expiration
• 16 custom functions covering everything dividend investors need
• 30+ years of historical data
• Works in both Google Sheets and Microsoft Excel
• Built by a dividend investor, for dividend investors
Used by fundamental investors who want institutional-grade data without the institutional price tag.
About GrowPanel
GrowPanel is a robust subscription analytics platform tailored specifically for SaaS companies seeking to gain clarity on their revenue metrics without the complexity of traditional spreadsheet management. By seamlessly integrating with billing platforms like Stripe, Chargebee, and Recurly, GrowPanel provides instant access to key performance indicators such as Monthly Recurring Revenue (MRR), Annual Recurring Revenue (ARR), churn rates, customer retention, expansion revenue, and cohort analysis. This real-time data empowers organizations to make informed decisions swiftly, enhancing productivity and operational efficiency. Founded by Lasse Schou, who successfully scaled Mouseflow from zero to $10 million ARR, GrowPanel is designed to support high-growth businesses aiming for sustainable revenue growth. With a user-friendly interface and mobile-friendly dashboards, even non-technical users can harness the power of detailed analytics to drive impactful business strategies.