Equals

About Equals
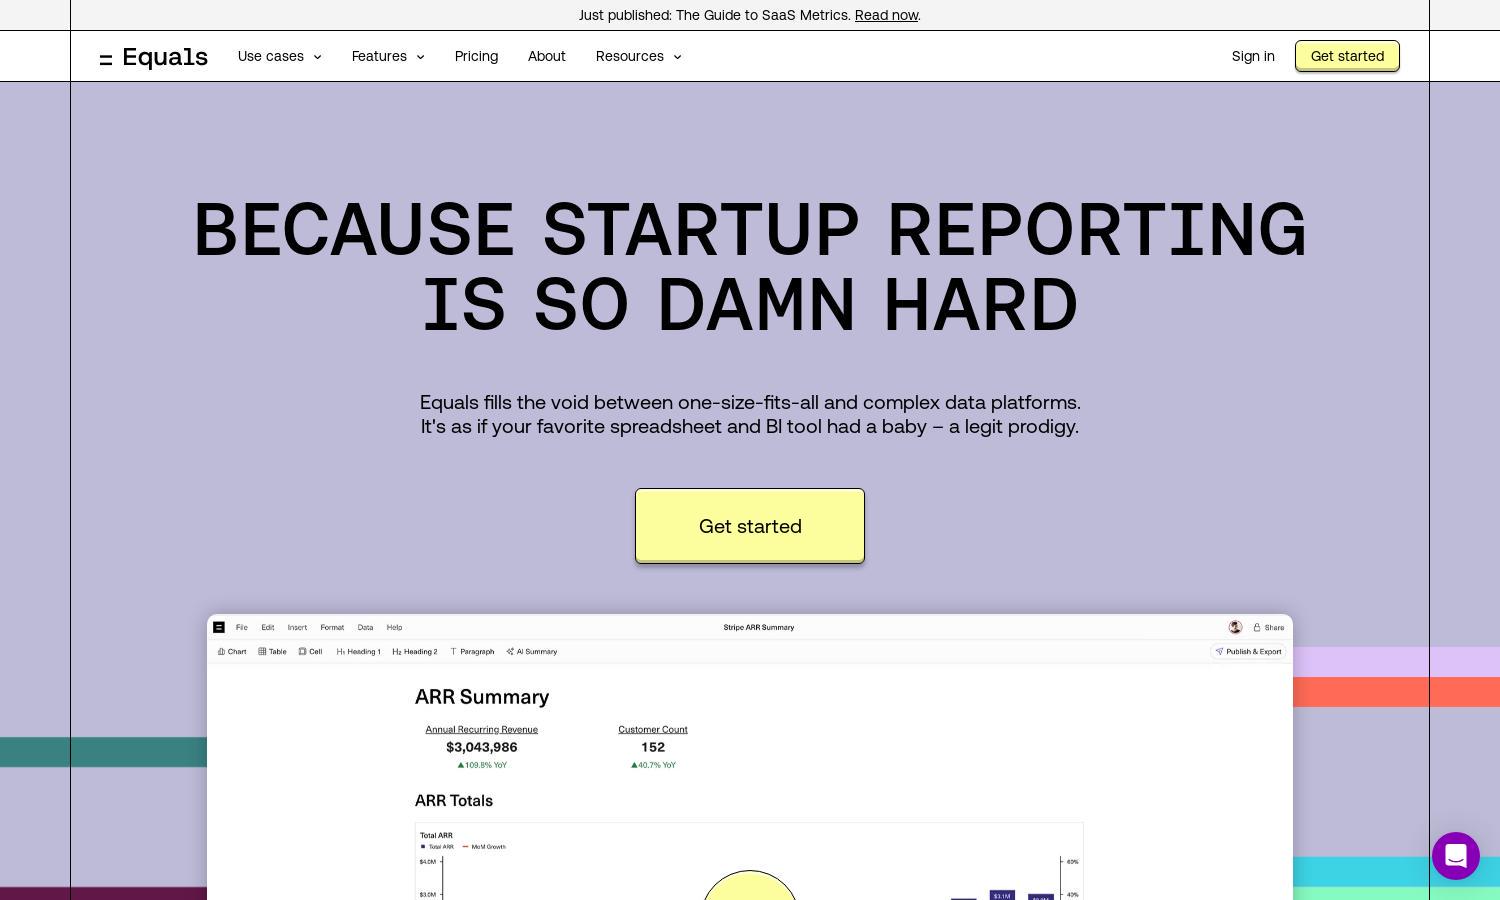
Equals is a revolutionary spreadsheet solution tailored for SaaS businesses, providing live data integration and automated reporting tools. Its user-friendly interface allows users to analyze and visualize key metrics effortlessly. Designed for startups, Equals empowers informed decision-making, making complex data exploration simple and efficient.
Equals offers flexible pricing plans designed to suit various business needs. Its subscription tiers cater to startups at different stages, enabling robust reporting and analytics. Users can expect significant value at each level, with incentives for upgrade options enhancing their data management capabilities.
Equals features a clean, intuitive interface that ensures a seamless user experience. Its organized layout allows users to navigate effortlessly between reports and dashboards. Unique functionalities, like customizable dashboards and live data connections, enhance usability, making data analysis enjoyable and efficient.
How Equals works
Users begin by signing up for Equals, where they are guided through onboarding. Once set up, they can connect data sources like Stripe and Salesforce. The platform's user-friendly dashboard allows for effortless navigation and data analysis. Equals empowers users to automate reporting and visualize metrics efficiently.
Key Features for Equals
Live Data Connections
Equals stands out with its live data connection feature, enabling real-time integration with platforms like Stripe and Salesforce, ensuring businesses always have the latest insights. This unique aspect enhances decision-making and reporting accuracy, making Equals an indispensable tool for modern SaaS companies.
Automated Reporting
With Equals, users benefit from automated reporting, which streamlines the process of generating key metrics and insights. This invaluable feature saves time and minimizes human error, making it easier for businesses to focus on strategy and growth, thus enhancing their operational efficiency.
Customizable Dashboards
Equals offers customizable dashboards tailored to individual business needs, allowing users to visualize metrics that matter most. This feature enhances user experience by providing flexibility in data presentation, ensuring that insights are both accessible and actionable for informed decision-making.
You may also like:


